eCognition System Administration
The Job Scheduler controls the services for batch processing and allows distributed job processing.
Monitoring Processing in a Web Browser
If you use eCognition Server for processing, you can control the status of jobs submitted for processing via a web browser.
- You can enter a web address that is identical to the entry in the Job Scheduler entry of the Start Analysis Job dialog. If a local Job Scheduler is used, you can enter
http://localhost:8184 - The HTML page is split into four parts, where you can resize the panes by clicking on the dividers and dragging them:
- User Jobs lists all jobs on schedule.
- Job Number Overview lists all projects of a selected user job
- Engines lists the Analysis Engine software instances of participating processing nodes.
Engine Usage displays the capacity utilization of all Analysis Engine Software instances of participating processing nodes.
Review User Jobs
Look in the User Jobs pane to see all jobs on the scheduler. There are four options you can use to filter this list; any filter in use is surrounded by asterisks:
- All is the default.
- Active Jobs are those currently being processed.
- Inactive Jobs lists successfully completed jobs and those that failed or were cancelled.
- Failed lists only those that did not successfully finish.
Look at some of the available data in this pane:
- Gray text means that the job has been closed because the workspace has been updated and the job will soon be deleted from the database.
- Click Active, to display only jobs currently running.
- Push the Refresh button to reload the site.
- Click Log to see additional information about how the job was processed. The log lists the dates of events, followed by machine and Analysis Engine Software number and the type of event, which are either connecting or shutting down of an instance of Analysis Engine Software.
- Click on the index number of a job in the User Jobs pane to view its details in the Job Number Overview pane.
Review Job Overview
In the User Jobs pane, click on the job number in front of a job to switch to the Job Number Overview pane and review processing details. Click “1” to view the processing status of each project sent for processing, which is one of the following:
- Failed
- Waiting
- Canceled
- Processing-done
- Unauthorized
- Timeout
- Crashed
- Licensing2
If you wish to stop the current job displayed, click Cancel in the upper-right corner.
View Job Details
In the Job Number Overview pane, you can review processed jobs by monitoring the status of each project sent for processing. You can click on the item number of a project to switch to the Job Details pane.
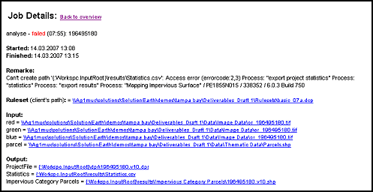
If processing failed, look in the Remarks section for further information. Other information displayed includes the start and end times, the local path of the utilized rule set, a list of the image layers submitted for processing and the path of all the output files you specified in the Configure Exported Results dialog box, and the used configuration of the Analysis Engine Software.
Show Log
Click the Show Log link at the bottom of this page to display configuration information for the current job.
Monitor Analysis Engine Software Status
In the Engines pane, the participating Analysis Engine Software instances of participating processing nodes are listed. Filter them by selecting either only the “active” or “inactive” instances. The status of an active instance is idle. The status of instances whose analysis could not be completed is set to timeout. Click on the item number to display details. If an error occurred during processing, check the Remarks pane.
Review Analysis Engine Software Usage
The Engine Usage pane displays two graphs representing capacity utilization of all Analysis Engine Software instances of participating processing nodes. The left-hand graph represents the workload of the last 60 seconds while the right one displays data for the last 24 hours.
Reopen a Job
If the text for a job in the User Jobs pane is gray, the processing states and result references have been updated in the workspace. Processing states and the result references will eventually be deleted.
If you close a workspace before processing is complete, the relevant entry will not turn gray until the workspace is reopened and updated. Once a workspace has been updated, and the line is therefore gray, the job will be deleted from the database.
- If you need to reopen a job, double-click the job number to open the job in the Job Number Overview pane.
- Click Reopen to reopen the job.
- The line in the User Jobs pane will turn black again.
Manual Configuration Settings and Default Values
General
- Temp path is used for eCognition cache files. During image analysis, the temp folder is used to store working files that may consume large amounts of disk space. Examples are:
- d:\temp
- /tmp
Ensure the user who runs the Analysis Engine Software has access rights to this temp folder.
- License Check Timeout: In case the license is not available at application startup, the license check is retried for twice. Set the time in seconds before the license will be requested again.
- Enable File Mapping: In cases of low system memory conditions you can activate file mapping to use memory-mapped files for allocating huge processing memory blocks. The default value is false.
Logging
- Log Path: Path of log files, for example .\Logs
- Max. File Size: Integer value specifying the maximum size in bytes for the log file. The default value is 10485760. After a file size is reached, the file is deleted and recreated. A zero value means no size limit; bear in mind that this can result in extremely large files.
- Trace Level: Level of detail in log files. Select 1 to increases the level of detail. Available values are 0 and 1
File Management
- Samba shares prefix, for example /mnt.
Samba sharesare are assumed to have computer name denoted in lower case. For example, for Abcd1 the samba share should look like /mnt/abcd1 not /mnt/Abcd2.
ODBC
- Oracle DSN: ODBC data source name used for connecting to any storage of type Oracle ODBC, for example “My Oracle”
ArcSDE Settings
- Connection File Location: The value of a variable defining the path of the folder containing files with ArcSDE Connections, for example .\Connections
CSV Settings
- Decimal separator: A separator of decimal numbers used for export as comma-separated value files, such as a period (.)
- Column delimiter: A delimiter used for export as comma-separated value files, such as a semicolon (;)
DIAGRID
- Numbers of Engines: The number of instances of Analysis Engine software available for processing on this processing node. To change the number of engines, we recommend using the Properties of Node, which avoids having to restart the Control Service afterwards. Use −1 to start as many threads as the number of CPUs installed on the machine. This is also true for hyper-threading CPUs. Example values are 1, 4 and −1.
A hyper-threading CPU is not a regular CPU. If one thread is started on the regular CPU and another is started on the hyper-threading CPU, the hyper-threading CPU is significantly slower than the regular CPU. However, you need a license for each thread. - Job Scheduler: The port the Job Scheduler monitors. Examples are
http://localhost:8148andhttp://T41pn015:8148. Take care when changing the port. Do not change this value if there is no special need. - Config Service: Port of the Configuration Services of all nodes of the eCognition. It is used for communication among Configuration Service and other components. Examples are
http://localhost:8148andhttp://T41pn015:8148. Again, do not change this value if there is no special need. - Use Config Service: The Configuration Service enables you to work with different software configurations. You can disable (false) the Configuration Service to only use Analysis Engine software and Job Scheduler for processing data. Values are true and false
- Start Image Cache Manager: Selected image drivers require the activation of the Image Cache Manager. Values: true or false (default)
- Start Data Spooler: For each storage that you want to use, you must start a separate Data Management Spooler Service. Enter all names of storages to be started separated by commas, for example
development,qa,production
DIA Control Service
Configuration parameters for the Control Service:
- Install directory: Path to the Job Scheduler and the Analysis Engine Software executable files. Do not change this path if there is no special need.
- Restart time: Time in seconds at which the Control Service restarts a crashed instance of Analysis Engine Software or Job Scheduler.
DIA Config Service
Configuration parameters concerning the Configuration Service:
- Configuration folder: Path to the configuration files. Do not change this path unless there is a special need.
- Storage folder: Path to the storage files. Do not change this path unless there is a special need.
- Local service: The primary node provides a processing unit by default (true). To disable it, enter false.
DIA Job Scheduler
Configuration parameters for the Job Scheduler:
- Database File: The database of the Job Scheduler is stored by default below the ProgramData folders. The default path is C:\ProgramData\eCognition\AdminConsoleData\JobScheduler64.dat. In some cases the size of the database can exceed 2GB.
Settings
- Engine status timeout: Time in seconds before the Analysis Engine Software status is set to timeout. If the Analysis Engine Software answers after the preset timeout the status is set back to the current status.
- Engine idle timeout: If an instance of the Analysis Engine Software did not receive any job during a specified time, the engine idle timeout, it will be canceled.
- Orphan job timeout: When a job is assigned to an instance of the Analysis Engine Software, the Job Scheduler takes it out of the job queue and waits until the Analysis Engine Software comes and takes the job. If that does not occur during a specified time, the orphan job timeout, the job will be again added to the job queue.
- Days to keep history: Time in days the processing states and result references are kept in the history. Afterwards they will be deleted.
